How to programmatically color a pie chart
While working on a project, I wanted to color a pie chart with a variable number of sections: for each asset a different color should be assigned. How best can we programmatically color the pie chart to have visually pleasing and distinct colors ?
To make a visually pleasant pie chart, adjacent colors should be different enough so we can distinguish them with the naked eye.
The naive approach is to hard code a list of colors, say 10 colors. But what if the number exceeds 10 ? we could build multiple lists of colors (for example 10, 20, 50 colors) and then pick the list that can cover the number of assets.
This works but has some limitations. Firstly it’s difficult to handle a high number of assets, like 100 or more and second you have to manually build those. This is tedious and not flexible if we want to change the color palette later.
Secondly if the number is too far from the the number of colors in the list the colors won’t look evenly distributed (like when you need 30 only colors but the list has 50)
Theoretical solution
To solve this, I came up with a simple algorithm to dynamically build a list of diverse colors who are equidistant and distinguishable.
This is how it works:
First it’s easier for an algorithm to deal with numbers, so how do we map colors with numbers ? Color can typically be described as RGB, HEX or HSLV.
RGB not mon ami
RGB stands for “red green blue” and describes the combination of the three primary colors needed to any color. To get the yellow color, add green and red in equal proportion. This representation comes from the physics of light : adding 2 beams of color, one green light and one red light, when superimposed reveals the yellow [1]. That’s why we call this way of mixing color “additive”: an addition of wavelength. Therefore yellow can be represented by rgb(255, 255, 0). the values vary from 0 to 255 for each rgb color. This is all fine but rgb is not really intuitive. as a child for example we would first get used to subtractive methods of creating color: to get a green color we would mix yellow and cyan paint. Paint absorbs certain wavelengths of light, while reflecting others. The absorbed wavelengths are "trapped" by the paint, while the reflected wavelengths are what we see as the color of the paint.
When two paints are mixed together, the resulting color is determined by the wavelengths of light that are absorbed by each paint. Yellow paint absorbs wavelengths of light corresponding to the colors red and green, while cyan paint absorbs wavelengths corresponding to the colors blue and green. The resulting color will be a blend of the absorbed wavelengths, which in this case is green.
HEX is complex
HEX is just another representation of RGB which is more compact but also even less intuitive. To get the hex value convert each of the 3 RGB values in base 16 and concat the three values. To represent yellow for example: 255 = 15*16+15 = #ff in hexadecimal form. The final value for yellow would be #ffff00.
HSL the holy grail
HSL stands for hue saturation and lightness.
Hue is the type of color that we can clearly distinguish with a different name (red, blue, green etc..). It’s measured in degrees : 0 and 360 is red
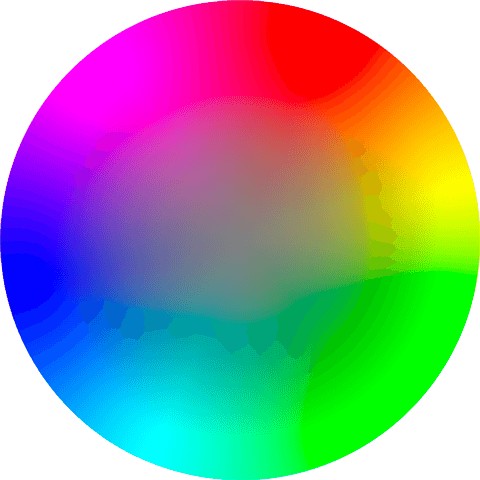
Saturation is the amount of color (hue) that is used. Think of it as the amount of pigments one would use: high saturation means high number of pigments.
Lightness represents the amount of black or white added to the color. 0% is black, and 100% is white (whatever the hue or saturation)
Changing HSL values is closer to how humans experiment with color mixing or changing lightness.
HSL is a more effective representation of color because the distance between different points in the HSL color space corresponds with the way that a human eye perceives these colors to be different from each other. In other words, the distance between two colors in the HSL color space will appear similar to the way that a person would perceive these colors to be distinct from each other when looking at them with the naked eye.
An increase in l (lightness) will indeed look brighter as if it has been placed under a spotlight.
Increasing saturation of red is like adding more of that red paint to make it more red.
To come up with this routine I noticed a few properties. Note that many of those observations are relatively subjective because it’s entirely dependent on my eyes and different people might notice more or less than I did. Nonetheless the principles should stay the same and you can always tweak those properties yourself.
- A saturation below 15 independent of h and l is grey. We can safely ignore saturation values below 15 because even if we differentiate the h and l the result will look grey for our eyes ⇒ our algorithm will not explore this subspace.
- Extreme lightness practically removes the color : lightness below 10 is too black, and above 97 too white.
- A difference in saturation can be noticed by an increment of 10 units. below that it’s difficult to notice (at least for me) ⇒ step in saturation = 10
- A difference in luminosity can be noticed every 5 units increment ⇒ step in luminosity = 5
- Luminosity of 50% is neutral to the hue and saturation
- For a given hue a change in luminosity is more easily perceived than a change saturation
- After experimentation I noticed that the hue range could be divided into 20 colors that can be easily distinguishable by the human eye. Those colors are usually way more different among them than when you change the saturation or luminosity. For example, orange and blue are more distinct from each other than light blue and azure, even though they have the same hue. This is because light blue and azure have slightly different levels of luminosity and saturation. Hence if the required number of colors for the pie chart is less than 20 we can just divide the hue range equally by that number and let the Saturation and Luminosity fixed. So varying the hue is always more preferable (in this sense more distinguishable) than varying saturation or lightness, so we should always prefer splitting the hue space over the other 2 dimensions.
- For a given hue the we can easily distinguish 4 different luminosity values and a maximum of 2 saturation values
Note: we can also use hwb but it is close to the hsl model (opens in a new tab) that we can ignore it.
You can try here (opens in a new tab)
For our algorithm we have one constraints:
Since it’s a pie chart, we don’t want adjacent colors to be identical. Optimally we would want to maximise the “color distance” between all adjacent colors to help with naked eyed distinguishability.
Hence given colors we want to distribute those across the full spectrum of 3d space of color to maximise the distances.
Code here (opens in a new tab)
Other considerations: the hue values are circular, value 360 = value 0 = red.
So we will iterate from 0 to 360 excluded for the hue
Code solution
Now that the problem is stated, our assumptions described and our constraints specified, we can write a solution in javascript:
If the number of colors are more than the hue we have the general algo
numberofhsl.hue = math.ceil(
  numofcolors / numberofhsl.luminosity / numberofhsl.saturation
);
Pseudo-code below
Based on the number of hues we split in different ways.
// we set the limits of our space
const max_hsl = {
  hue: 360,
  saturation: 90,
  luminosity: 65,
};

const min_hsl = {
  hue: 0,
  saturation: 20,
  luminosity: 27,
};

const numberofhsl = {
  hue: 0,
  saturation: 0,
  luminosity: 0,
};
const max_number_of_hues = 20;

if (numofcolors > max_number_of_hues && numofcolors < 4 * max_number_of_hues) {
  numberofhsl.saturation = 2;
  numberofhsl.hue = 20;
  numberofhsl.luminosity = 2;
  min_hsl.luminosity = 37;
} else if (numofcolors > max_number_of_hues) {
  numberofhsl.saturation = 2;
  numberofhsl.luminosity = 4;
  numberofhsl.hue = math.ceil(
    numofcolors / numberofhsl.luminosity / numberofhsl.saturation
  );
} else {
  numberofhsl.hue = numofcolors;
  numberofhsl.luminosity = 1;
  numberofhsl.saturation = 1;
}

const steps = {
  hue: undefined,
  saturation: undefined,
  luminosity: undefined,
};

// divide the hsl equally
object.keys(max_hsl).foreach((key) => {
  steps[key] = parseint((max_hsl[key] - min_hsl[key]) / numberofhsl[key]); // floor the value to int
});

let result = [];

for (
  let currenthue = min_hsl.hue + steps.hue;
  currenthue <= max_hsl.hue && result.length <= numofcolors;
  currenthue += steps.hue
) {
  if (numberofhsl.hue === numofcolors) {
    result.push(`hsl(${currenthue}, ${68}%, ${70}%)`);
  } else {
    for (
      let currentsaturation = min_hsl.saturation;
      currentsaturation < max_hsl.saturation && result.length < numofcolors;
      currentsaturation += steps.saturation
    ) {
      for (
        let currentluminosity = min_hsl.luminosity;
        currentluminosity < max_hsl.luminosity && result.length < numofcolors;
        currentluminosity += steps.luminosity
      ) {
        result.push(
          `hsl(${currenthue}, ${currentsaturation}%, ${currentluminosity}%)`
        );
      }
    }
  }
}

assert(result.length === numofcolors);

let sortedresult = [];
let gap = 3;
let index = 0;
let boolresult = array(result.length).fill(false);
sortedresult[index] = result[index];
boolresult[index] = true;
while (sortedresult.length !== numofcolors) {
  index = (index + gap) % result.length;
  if (!boolresult[index]) {
    sortedresult.push(result[index]);
    boolresult[index] = true;
  } else {
    index++;
  }
}

return sortedresult;
Full code here (opens in a new tab)
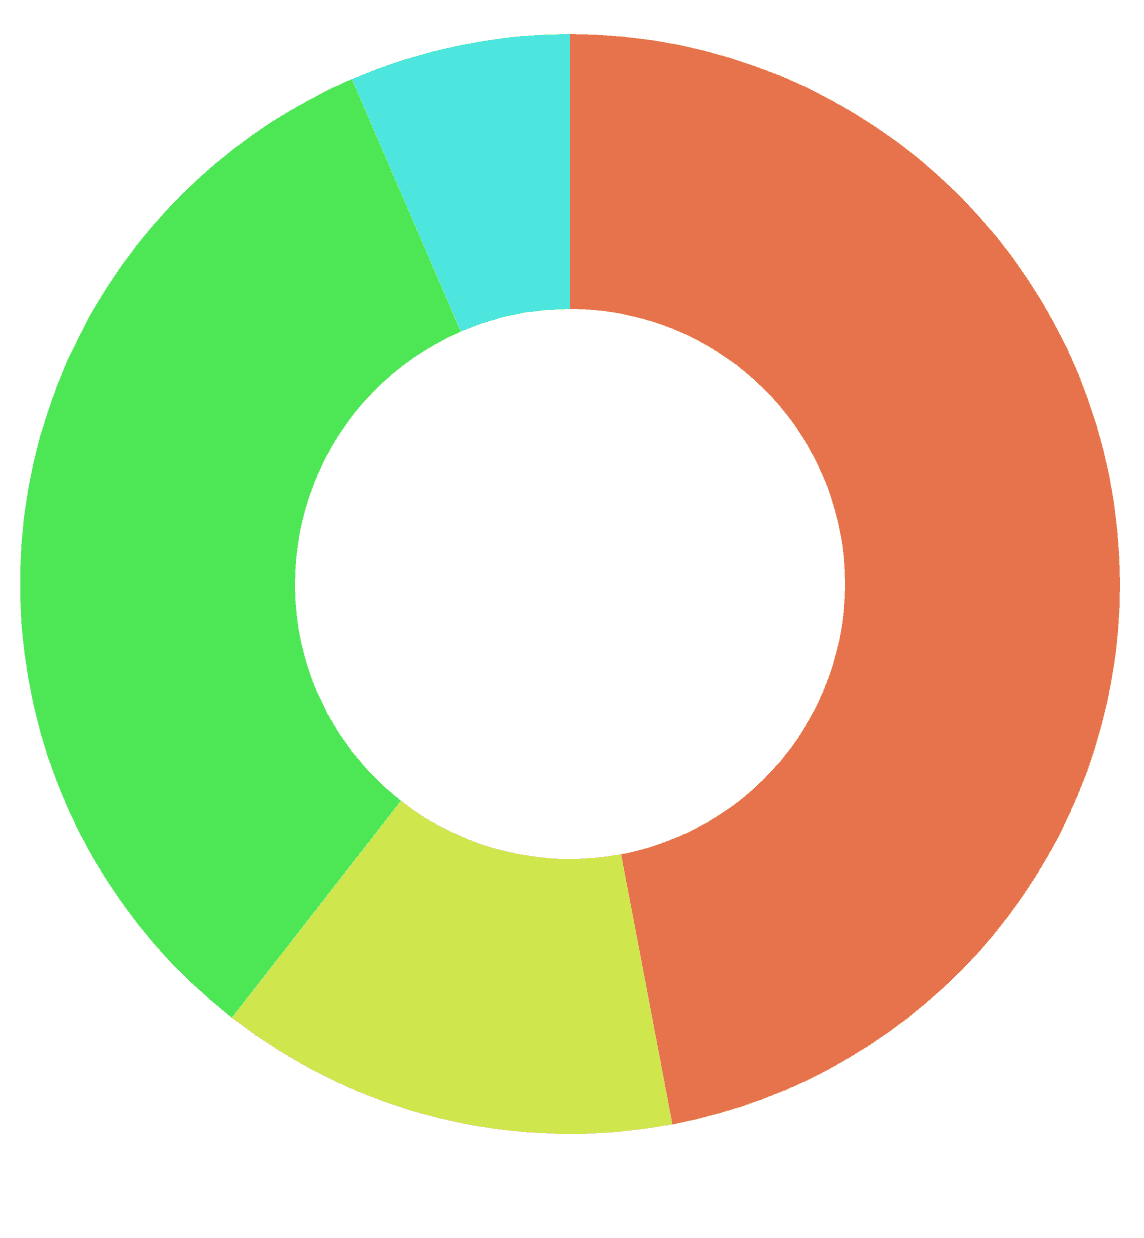
Result for 4 colors
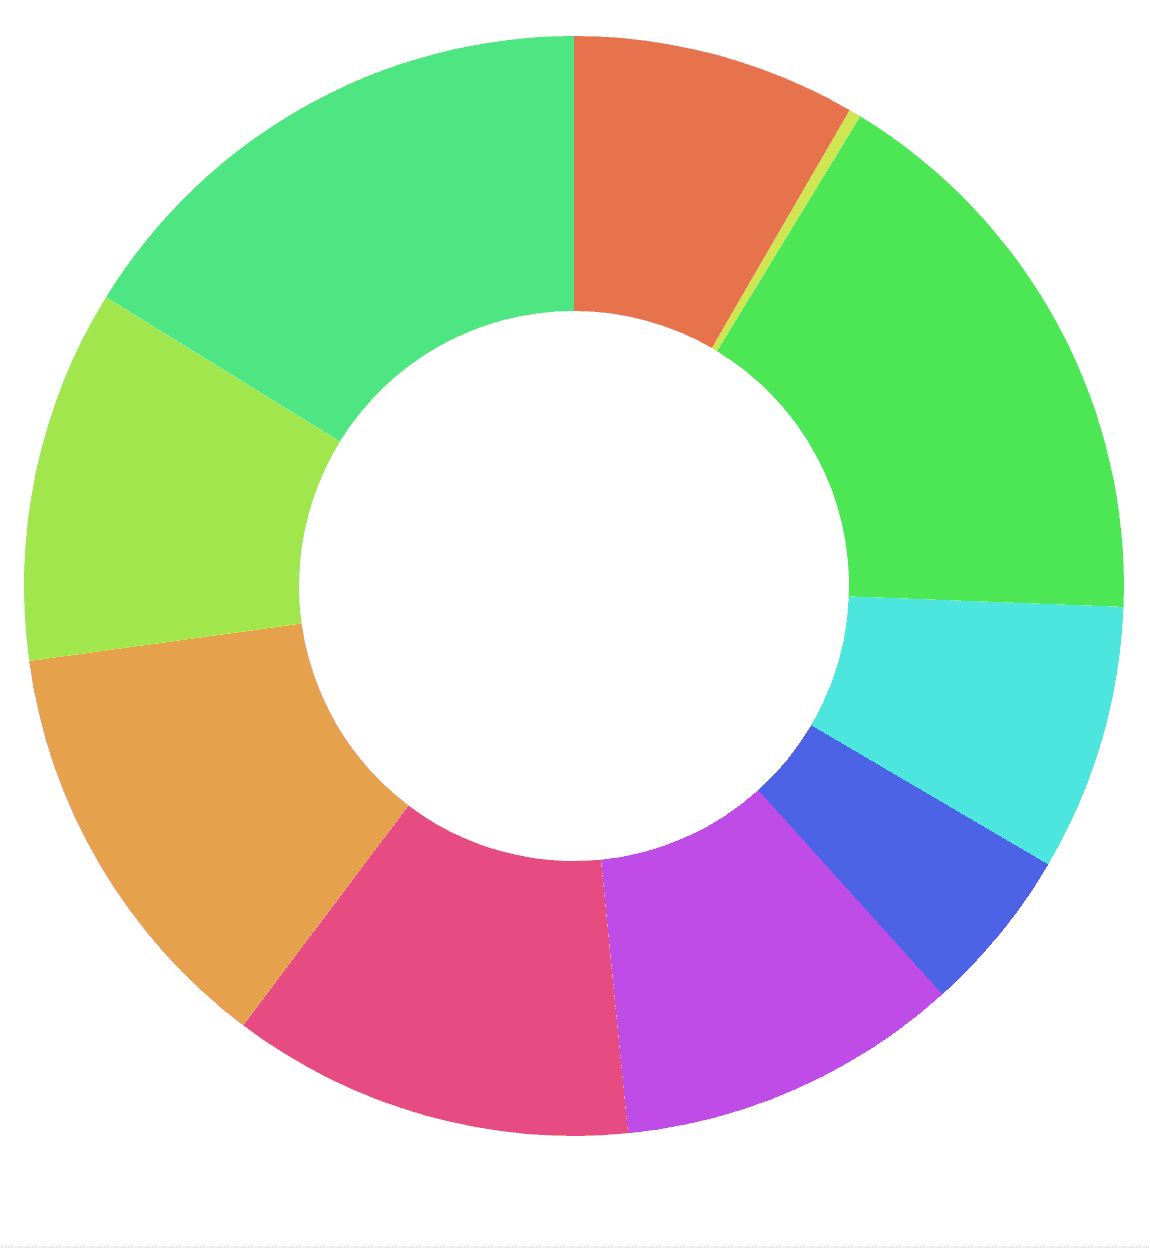
Result for 10 colors
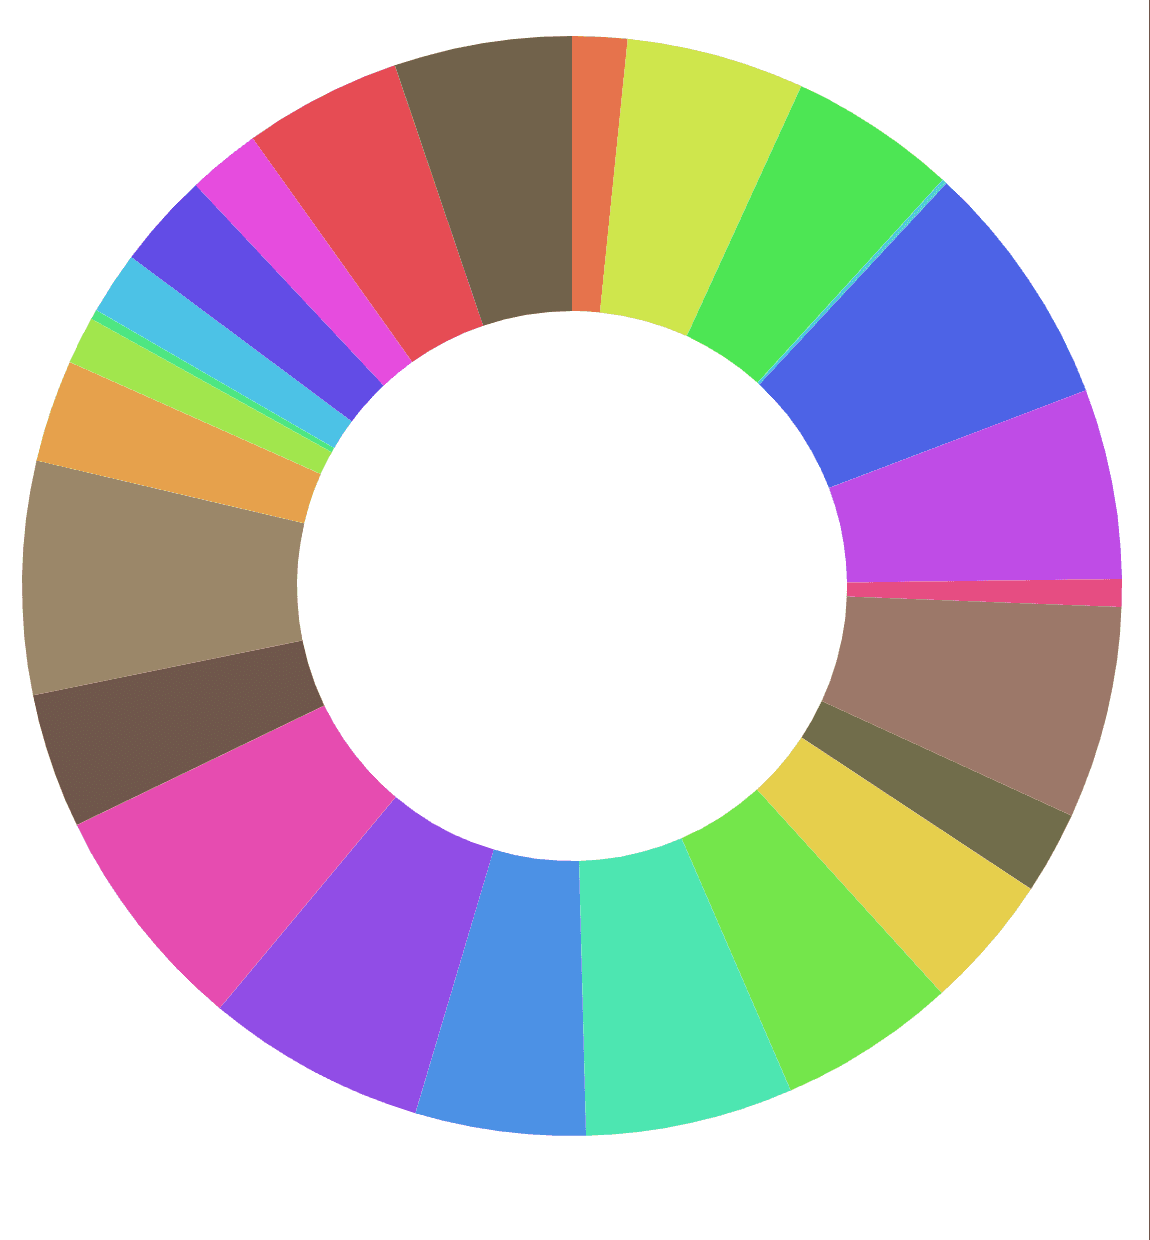
Result for 25 colors
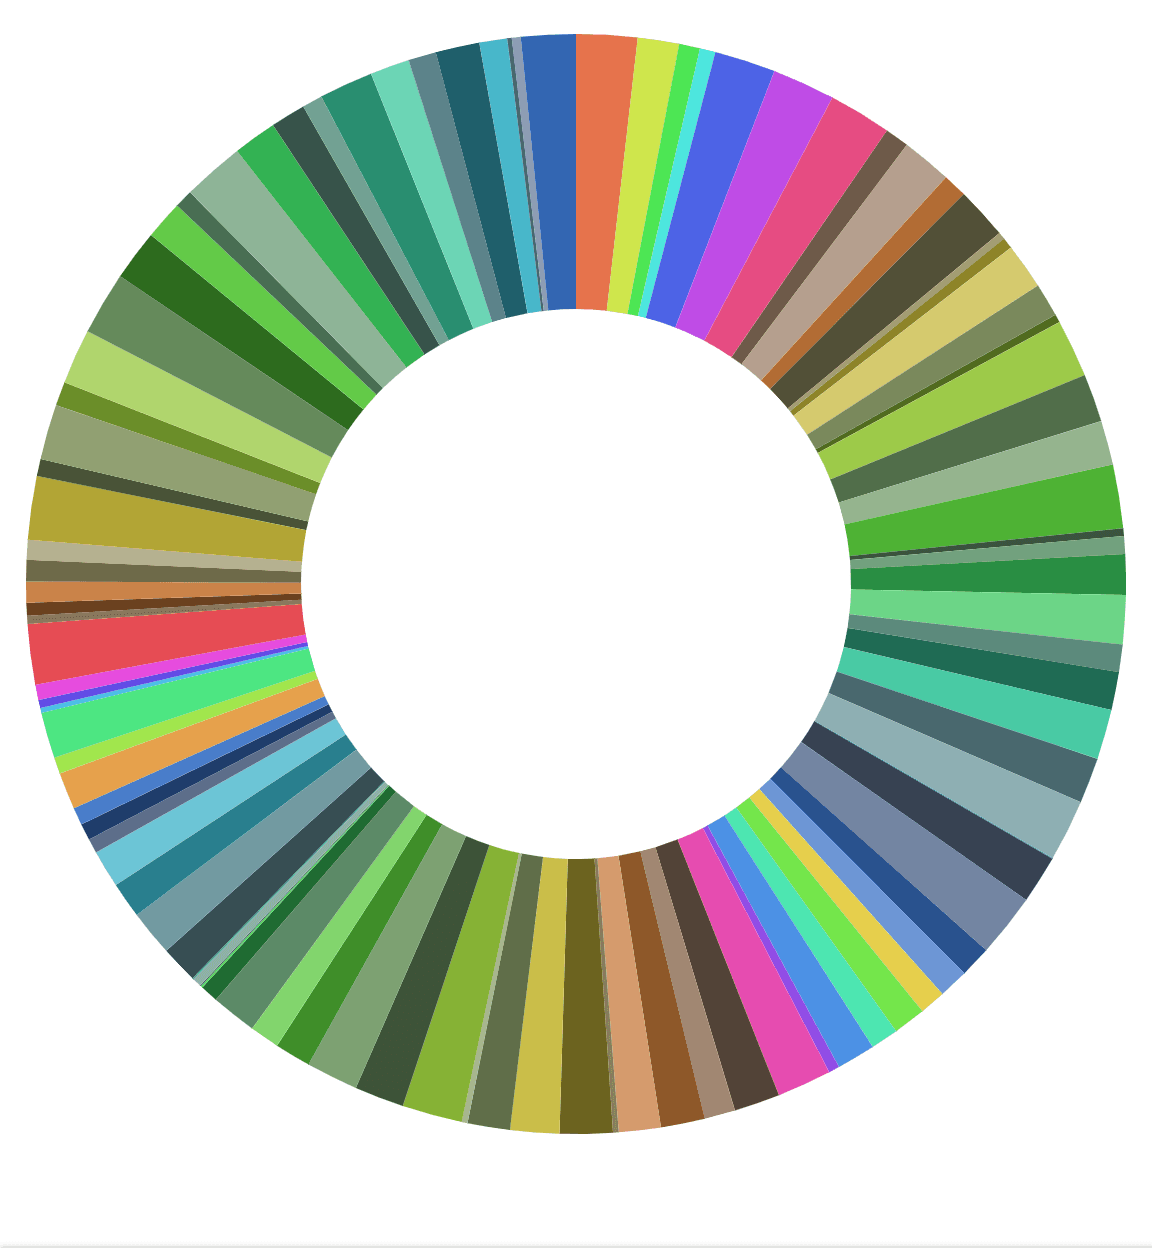
Result for 100
Monochromatic
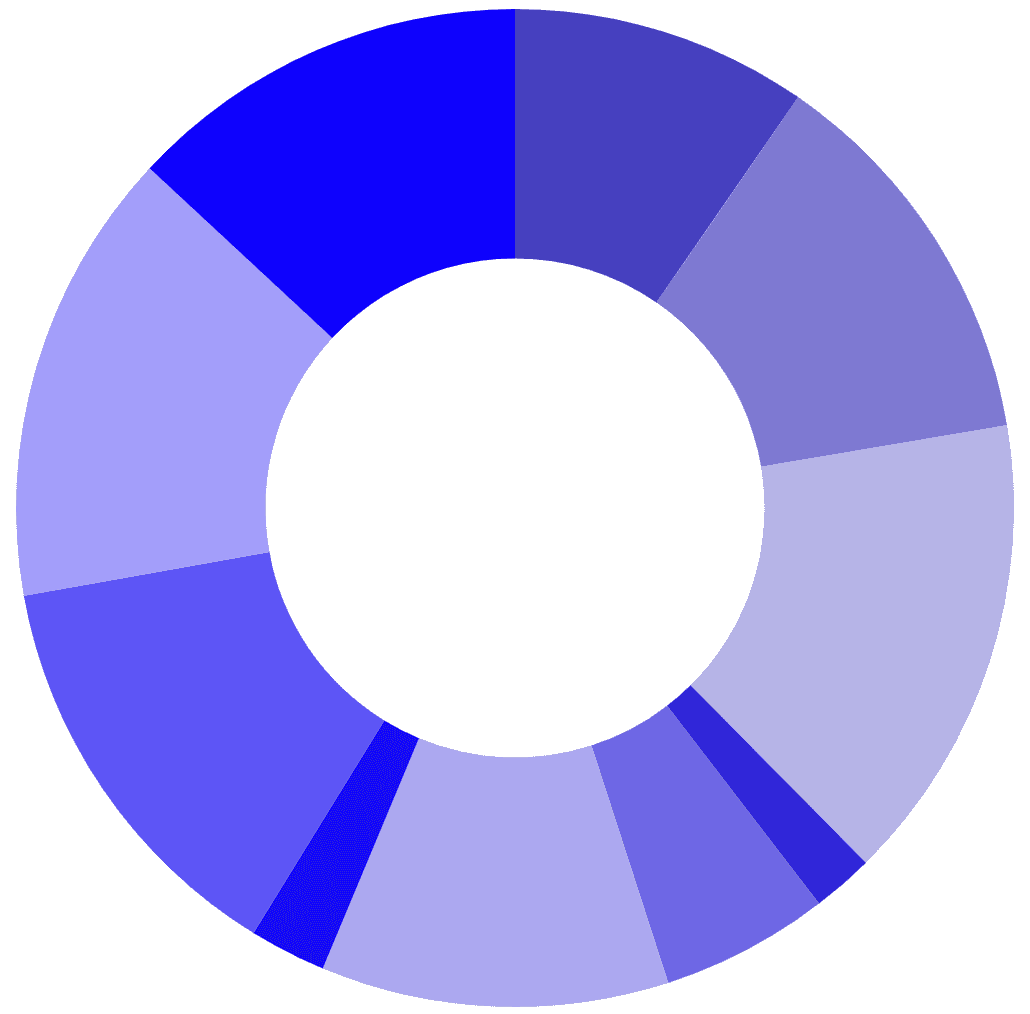
If we wanted to have a pie chart with only one kind of color for example a blueish pie chart, we could fix the hue and then use the same algorithm to exhaust the remaining space of Saturation and Luminosity.
This will give us this (opens in a new tab)
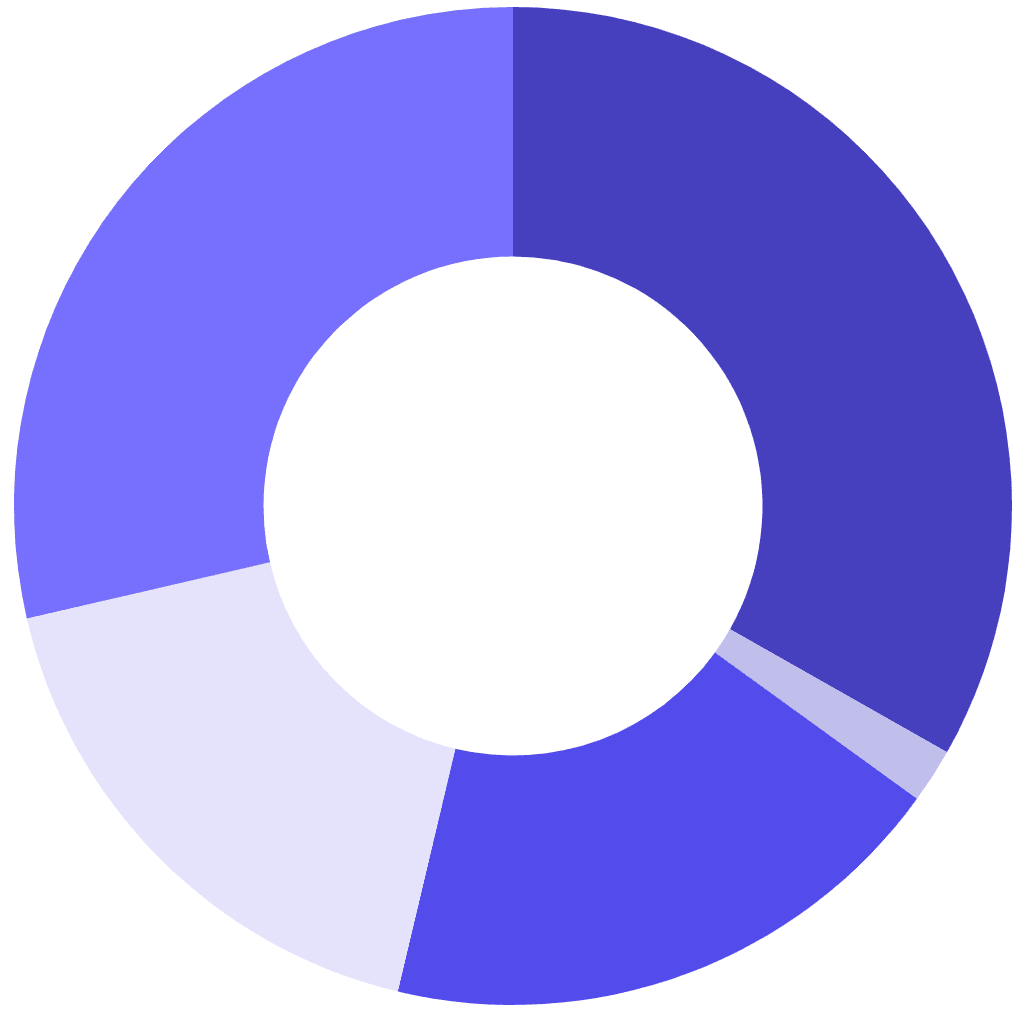
Result for a blue pie chart and 5 assets
Result for a red pie chart and 10 assets
https://codesandbox.io/s/youthful-fog-jxr06t?file=/src/colorizer.js (opens in a new tab)
https://github.com/invizi/invizi/search?q=piedata (opens in a new tab)
We just developed a simple algorithm for generating a list of distinct colors that can be used for the pie chart. By mapping colors to numbers and using the HSL color representation, we were able to create an algorithm that is simple, intuitive, flexible, and effective in most cases. We could apply this to many other domains as long as a programming language is used like data visualization, game development and design projects.
This algorithm is really simple and won't always produce great results, one might want to improve this or find another approach that is more resilient.
2024 © Beguène. - github.com/beguene twitter.com/beguene